Use surface charged hybrid (CSH) C
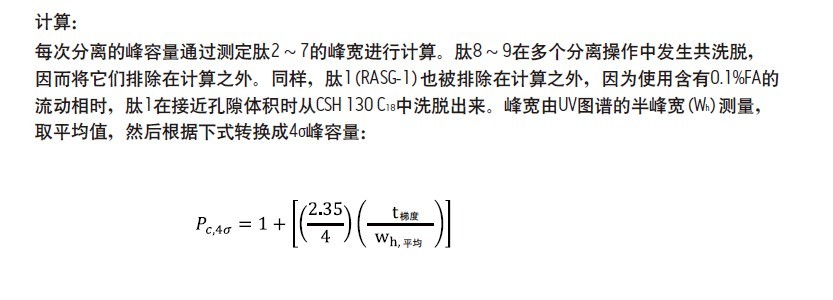
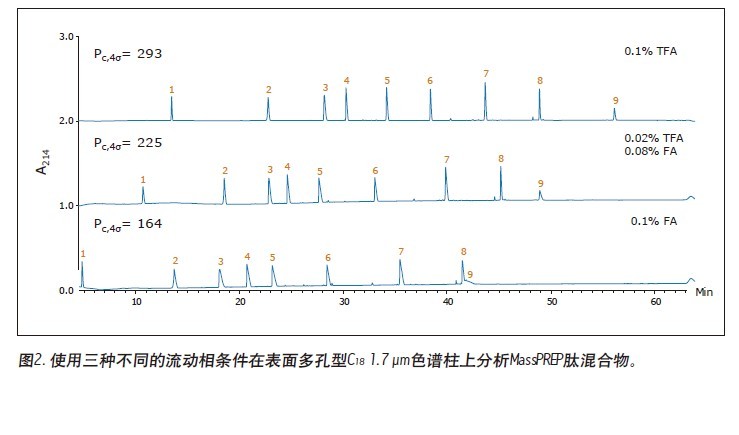
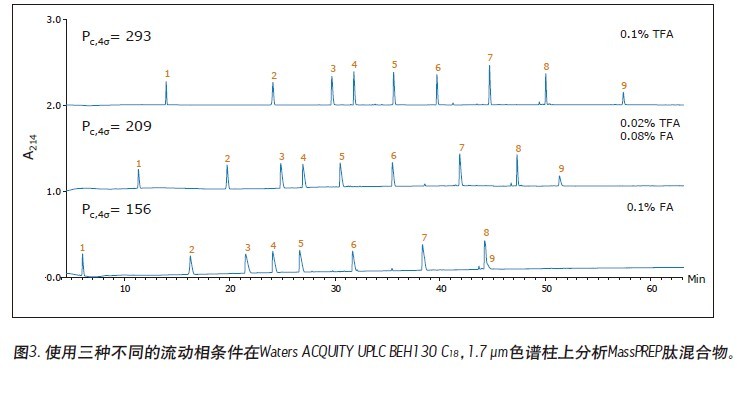
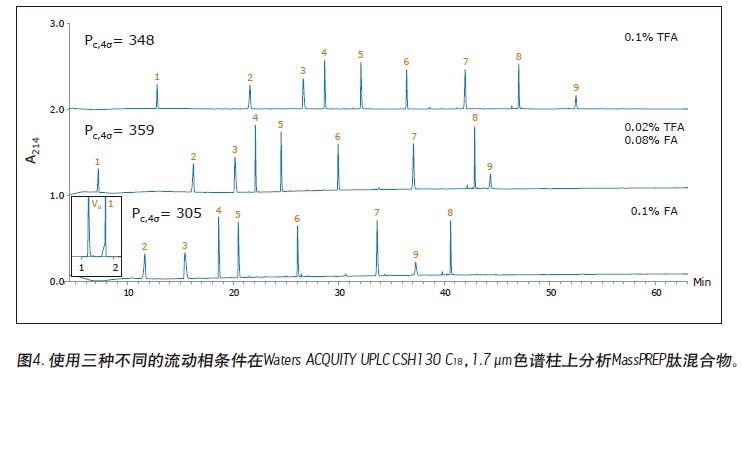
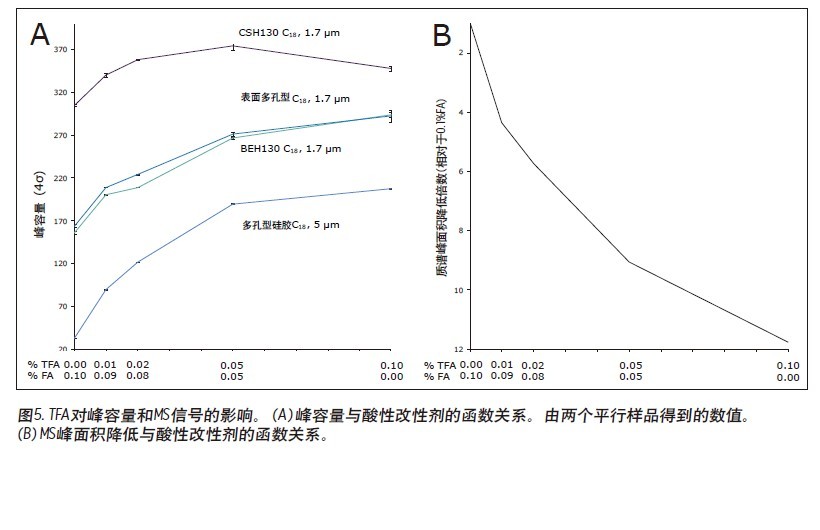
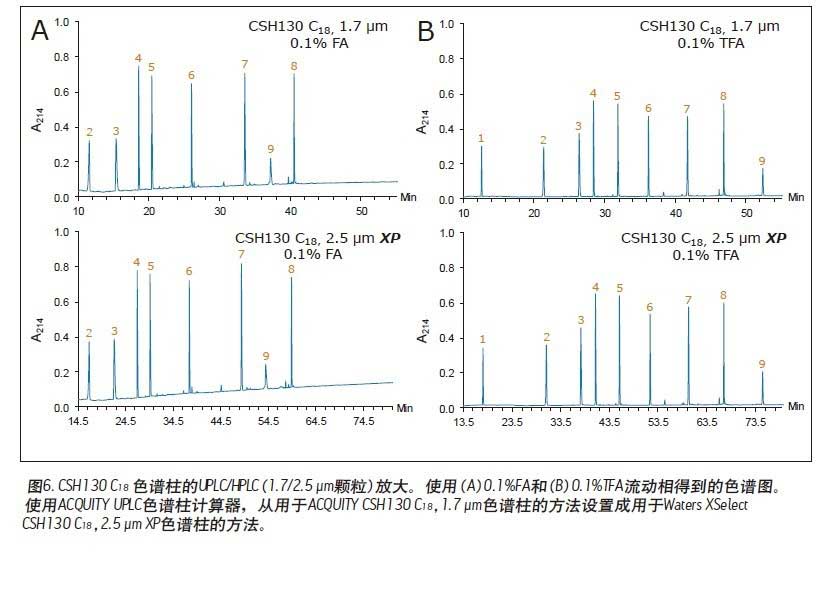
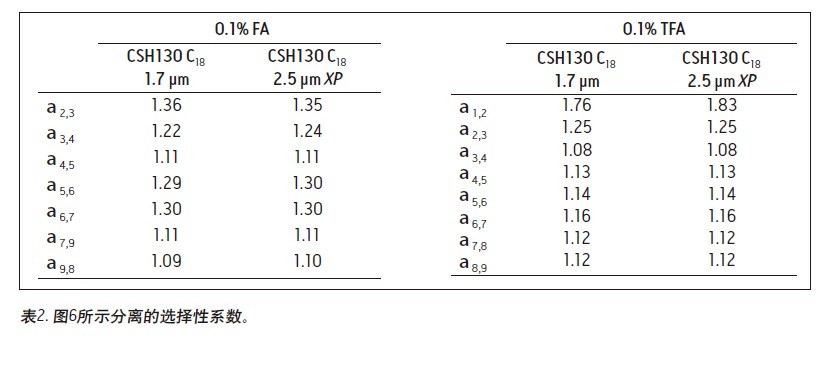
Matthew A. Lauber, Stephan M. Koza, and Kenneth J. Fountain Advantages Application of the inverted <br> isolated peptide peak capacity and higher-carboxylic acid compatible with a mobile phase applied to the two kinds of particles and HPLC UPLC® Waters Solutions <br> inverted keyword, peptides, trifluoroacetic acid (TFA), formic acid (the FA), an ion pair, the surface of the charging hybrid (CSH), peak capacity Introduction <br> both studies using peptide map 1 2 characterization of biopharmaceuticals, peptide separation techniques are still vital to the protein via a top-down proteomics. The mixtures encountered in these analyses are inherently complex. Due to its high resolution and its ability to easily interface with mass spectrometry (MS), reverse phase (RP) chromatography has become the preferred method of separation. The most closely related performance indicator for gradient reversed phase chromatography is the peak capacity, or the maximum number of peaks in the gradient time 3 . Interestingly, chemical modification of the stationary phase can have a significant effect on peak capacity in addition to using smaller filler particles. For example, the chemical properties of a surface-charged hybrid (CSHTM) C 18 column are an improvement over the ethylene bridge hybrid (BEH) C 18 stationary phase 4 because, besides the C 18 bonded phase, the surface is modified With a low level of positive charge 5. It has been shown that this modification can improve the peak shape, loading behavior and peak capacity of ionized small molecules by 5-10 . In the present study, we evaluated the peptide separation characteristics of CSH130 C 18 and expected a similar improvement in chromatographic properties because most peptides have a positive charge under the usual acidic conditions. Studies on peptides have shown that this novel phase can have greater peak capacity, unique selectivity, and lower dependence on MS signals than advanced stationary phases in peptide analysis. LC condition The MassPREP peptide mixture contains nine different peptides with different amino acid composition, mass, length and polarity. The peptide sequences are shown in Table 1. Since the mixture consists of such a diverse set of peptides, it is useful for evaluating mass spectrometry performance and chromatographic performance. In view of this, the peptide mixture was used as a separation property for detecting CSH130 C 18 relative to other stationary phases commonly used for peptide analysis. The study also included a stationary phase for the efficient separation of large pore peptides (100 Å to 300 Å) in mixtures, all of which have molecular weights below 3 kDa. Another separate application note discusses the use of a 130 Å pore size CSH130 C 18 to separate larger peptides. 11 In order to study the correlation, the loading amount of each peptide in the mixture is close to the common conditions used in the antibody peptide map, wherein 20 to 50 μg of Lys-C digest or trypsin digest is generally 2.0 mm or 2.1 in inner diameter. Analysis was performed on a mm column. 2, 12-13 Similarly, the separation is accomplished using a mobile phase containing a strong ion pair reagent TFA, a weaker ion pair reagent FA, or a combination of both. Reversed-phase separation of peptides is often used in conjunction with mass spectrometry, and the performance obtained under various conditions is quite noticeable. In these applications, formic acid is used instead of trifluoroacetic acid as a mobile phase additive because formic acid provides a more sensitive detection. 14-15 Figure 1 is a chromatogram of three MassPREPs obtained using a 5 μm silica gel C 18 column under different mobile phase conditions. The chromatographic peaks obtained by separation using TFA are generally symmetrical. Most peaks did not show excessive peak broadening or tailing. However, the peak shape obtained by using a mobile phase containing formic acid is extremely undesirable. In addition, the largest peptide in the mixture, melittin, was not detected, probably because the peak was too broad or not eluted at all. Such results are very common for peptide separation using HPLC. The use of sub-2 μm particles allows for superior peptide separation performance. The chromatograms obtained on two columns packed with 1.7 μm particles are shown in Figures 2 and 3. In particular, the chromatograms in Figure 2 were obtained using a superficially porous C 18 column. When TFA is added to the mobile phase, the resulting peaks are symmetrical and generally narrower than those obtained using a 5 μm porous C 18 column, as shown in Figure 1. When a very small amount of TFA is added to the mobile phase or no TFA is added, the chromatographic peak broadens and a significant tailing occurs. Under all test conditions, the effect of the fully porous BEH130 C 18 column separation was comparable to that of a superficially porous C 18 column, as shown in Figure 3. The separations shown in Figures 1 through 3 were used to test the performance of the peptide analysis of the CSH130 C 18 , 1.7 μm column. The corresponding chromatogram is shown in Figure 4. The comparison of Figures 1 to 4 clearly shows that, unlike mobile phases containing TFA or FA, unlike other columns, CSH130 C 18 provides the best peak shape. In addition, it is clear that CSH130 C 18 exhibits a unique selectivity – especially when using a mobile phase that does not contain TFA. For example, only 0.1% of formic acid was added to the mobile phase. On any other column used in this study (except CSH130 C 18 ), neither peptide 8 nor peptide 9 was well separated. When CSH130 C 18 is used, the two elutions are peak-shaped and separated in more than 3 minutes. In addition, there is also a difference in retention between these columns. Most notably, the retention of the CSH130 C 18 column was slightly weaker than the other columns covered in this study. This is a testament to the fact that CSH130 C 18 is the only one with a small amount of positively charged adsorbent on its surface. Coulomb repulsion between CSH130 C 18 peptide and a positively charged surface is likely to be lower because CSH130 C 18 retention capacity. The inset of Figure 4 shows the earliest elution fraction when using a 0.1% FA gradient on a CSH130 C18 column. Under these conditions, the most hydrophilic peptide RASG-1 (peptide 1) peaked near the pore volume label. Compared to the BEH130 C 18 column, the amount of ACN used in the CSH130 C 18 elution peptide is generally 2% to 4% less. When 0.1% TFA was used, the difference in retention ability was the smallest, while when 0.1% FA was used, the difference in retention ability was the largest. When analyzing highly polar peptides, the initial gradient conditions of CSH130 C 18 may need to be adjusted accordingly. Peak Capacity and Mass Spectrometry Signals <br> Comparison of these qualitative separations indicates that CSH130 C 18 has performance advantages over other columns. However, quantification is more compelling. The peak capacity observed in each separation was calculated according to the method of the experimental part. Figure 5A shows the relationship between the composition of the acid improver and the peak capacity on each column. The left part of Figure 5A is the peak capacity value obtained using only FA without the TFA ion pair reagent. The right side along the X axis is the peak capacity value corresponding to the decrease in the FA concentration and the increase in the TFA concentration. The performance advantages of the CSH130 C 18 column are easy to visualize. When using 0.1% TFA, the peak capacity of the CSH130 C 18 column is 20% larger than other 1.7 μm C 18 columns. However, if a mobile phase containing 0.1% formic acid is used, the peak capacity of the CSH130 C 18 column is 90% larger than the other 1.7 μm columns. Therefore, CSH130 C 18 not only has a larger peak capacity than other columns, but its performance is less dependent on trifluoroacetic acid. The most obvious result is that the CSH130 C 18 column is highly compatible with mass spectrometry. In these analyses, the effect of trifluoroacetic acid on peptide mass spectrometry is shown in Figure 5B. We know that during electrospray ionization, TFA causes severe ion suppression 16-17 . Therefore, when TFA is used instead of FA, the mass spectrum signal is reduced by a factor of 12. The CSH130 C 18 column does not require much TFA (if any) to achieve the best peak capacity, making it ideal for high sensitivity LC/MS applications. Particle size and UPLC/HPLC amplification Many peptide separation procedures are still performed on conventional HPLC instruments. Because of their high back pressure, columns packed with sub-2 μm are generally not suitable for use with HPLC systems. The 2.5 μm column can be used on any LC instrument due to its low back pressure. To determine if the peak capacity of the CSH130 C 18 , 1.7 μm column was successfully transferred to a CSH130 C 18 XP, 2.5 μm column, a 2.5 μm XP column was set up for transfer from a 1.7 μm column. HPLC compatible method. This transfer is as follows: Follow the recommendations of the ACQUITY UPLC Column Calculator 18 to reduce the flow rate and increase the gradient time. The reduction and increase factors are both 1.5. Figure 6 shows that the separation using a 1.7 μm column was successfully transferred to a 2.5 μm XP column. The consistency of the selectivity coefficients underscores this observation, as shown in Table 2. Compared to the 1.7-particle column, the back pressure is greatly reduced when using 2.5μm XP particles (~3000psi vs. ~8000 psi), indicating that CSH technology can be easily applied to peak capacity peptide separation by UPLC or HPLC. in. Due to the innovative application of low levels of positive charge, the CSH 130 C 18 column has proven to be a technology that enables peptide separation. Based on analysis of the nine peptide mixtures, we found that CSH 130 C 18 showed higher peak capacity and unique selectivity compared to non-surface charged C18 columns. It has been observed that the performance of the CSH 130 C 18 column is significantly reduced by the dependence of strong ion-pairing reagents (such as TFA, which can inhibit electrospray ionization). In addition, the separation results obtained using a CSH 130 C 18 , 1.7 μm column can be transferred to a CSH 130 C 18 , 2.5 μm XP column under HPLC conditions with low back pressure—although at the expense of analytical time. CSH 130 C 18 can be used with different particle sizes, making it easy to use UPLC for routine use (the daily use of these laboratories was limited to HPLC instruments), and it can be extended to UHPLC with a pressure limit of 9000~12,000 psi. 1. Yates JR, Ruse CI, Nakorchevsky A. Proteomics by mass spectrometry: approaches, advances, and applications. Annu Rev Biomed Eng. 2009; 11: 49-79. Dried Fruit,Freeze Dried Strawberries,Dehydrated Fruit,Dried Goji Berries Xi'an Gawen Biotechnology Co., Ltd , https://www.agolyn-bio.com
Waters Corporation (Milford, MA, USA)
CSH130 C 18 QC test using trypsin digest of cytochrome c
ACQUITY UPLC® H-Class Bio System
Xevo® G2 QTof mass spectrometer
ACQUITY UPLC CSH130 C 18 , 1.7 μm column
XSelectTM CSH130 C 18 XP, 2.5 μm column
MassPREPTM Peptide Mixture LCGC Certified Inner Cannula Clear Glass Vial
experiment
System : Waters® ACQUITY UPLC H-Class Bio system with a 20 cm or 30 cm column oven (150 mm column with 20 cm column oven; 250 mm column with 30 cm column oven)
Detection : ACQUITY UPLC TUV Detector with 500 nL Analytical Flow Cell; Xevo G2 QTof Mass Spectrometer
Wavelength: 214 nm
Scan rate: 10 Hz
Column:
ACQUITY UPLC BEH130 C 18 , 2.1 x 150 mm, 1.7 μm, porous, 130 Å (part number 186003556)
ACQUITY UPLC BEH130 C 18 2.1 x 150 mm, 1.7 μm, porous, 130 Å (part number 186006938)
XSelect CSH130 C 18 XP, 2.1 x 150 mm, 2.5 μm, porous, 130 Å (part number 186006943)
C 18 , 2.1 x 250 mm, 5 μm, porous, 300 Å (competitive manufacturer)
C 18 , 2.1 x 150 mm, 1.7 μm, superficially porous (core 1.25 μm, outer casing 0.22 μm) 100 Å (competitive manufacturer's product)
Column temperature: 40 °C
Sample temperature: 10 ° C
Injection volume: 10 μL
Flow rate: 0.3 mL/min
Mobile phase: A: 0.1% FA (v/v) aqueous solution B: 0.1% FA (v/v) acetonitrile (ACN) solution C: 0.1% trifluoroacetic acid (TFA) (v/v) aqueous solution D: 0.1% TFA (v/v) acetonitrile solution
Vial: LCGC-certified clear glass vial 12 x 32 mm threaded vial (part number 186001126C)
Gradient: 2% ACN was maintained for 1 minute and then increased to 50% ACN for 60 minutes (acid components were controlled by quantitative mobile phases A/B and C/D).
Mass spectrometry mass spectrometer: Xevo G2 Qtof
Ionization mode: ESI+
Analyzer mode: resolution
Capillary voltage: 3.00 Kv
Taper voltage: 25 V
Ion source temperature: 120 °C
Desolvent temperature: 350 ° C
Cone gas flow rate: 0.0 L/h
Desolvent gas flow rate: 800 L/h
Correction: NaI 2 μg/μL, 50 ~ 2000 m/z
Acquisition: 50 ~ 1990 m/z, 10 Hz scan rate
Data Management: MassLynx® Software
Sample Description <br> As shown in Table 1, MassPREP peptide mixture (Part # 186002337) using an aqueous solution of 0.1% FA was redissolved the total peptide concentration of about 0.6 mg / mL. 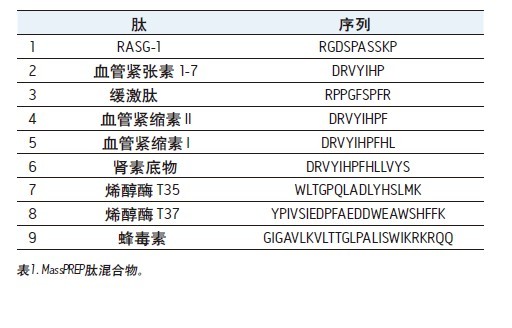
Results and discussion of peptide separation 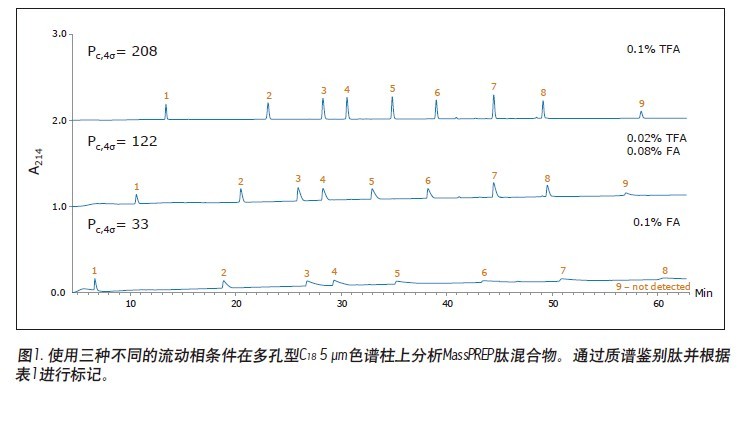
in conclusion
references
2. Richardson J, Shah B, Xiao G, Bondarenko PV, Zhang Z. Automated in-solution protein digestion using a commonly available high-performance liquid chromatography autosampler. Anal Biochem. 2011; 411(2): 284-91.
3. Neue UD. Theory of peak capacity in gradient elution. J Chromatogr A. 2005; 1079(1-2): 153-61.
4. Wyndham KD, O'Gara JE, Walter TH, Glose KH, Lawrence NL, Alden BA, Izzo GS, Hudalla CJ, Iraneta PC. Characterization and evaluation of C 18 HPLC stationary phases based on ethyl-bridged hybrid organic/inorganic particles Anal Chem. 2003; 75(24): 6781-8.
5. Iraneta PC, Wyndham KD, McCabe DR, Walter TH. Charged Surface Hybrid (CSH) Technology and Its Use in Liquid Chromatography. Waters White Paper 720003929EN. 2011.
6. Berthelette KD, Summers M, Fountain KJ. Modernization of the USP Assay for Clarithromycin Using eXtended Performance (XP) Column Technology. Waters Application Note 720004461EN. 2012.
7. Fountain KJ, Hewitson HB, Iraneta PC, Morrison D. Practical Applications of Charged Surface Hybrid (CSH) Technology. Waters Application Note 720003720EN. 2010.
8. Summers M, Fountain KJ. A Quality by Design (QbD) Based Method Development for the Determination of Impurities in a Peroxide Degraded Sample of Ziprasidone. Waters Application Note 720004072EN. 2011.
9. Summers M, Fountain KJ. Rapid Method Development through Proper Column Selection. Waters Application Note 720004353EN. 2012.
10. ACQUITY UPLC CSH Columns. Waters Applications Notebook 720003537EN. 2010.
11. Lauber MA, Koza SM, Fountain KJ. Peptide Mapping and Small Protein Separations with Charged Surface Hybrid (CSH) C 18 and TFA-Free Mobile Phases. Waters Application Note. 720004571EN. 2013.
12. Yan B, Yates Z, Balland A, Kleemann GR. Human IgG1 hinge fragmentation as the result of H2O2-mediated radical cleavage. J Biol Chem. 2009; 284(51): 35390-402.
13. Yu XC, Joe K, Zhang Y, Adriano A, Wang Y, Gazzano-Santoro H, Keck RG, Deperalta G, Ling V. Accurate determination of succinimide degradation products using high fidelity trypsin kissing peptide mapping analysis. Anal Chem. 2011 83(15): 5912-9.
14. Annesley TM. Ion suppression in mass spectrometry. Clin Chem. 2003; 49(7): 1041-4.
15. Temesi D, Law B. LC-GC Int. 1999;17: 626-32.
16. Affinity, Pl., Gl., G. 712(1): 177-90.
17. Kuhlmann FE, Apffel A, Fischer S, Goldberg G, Goodley PC. J Am Soc Mass Spectrom. 1995; 6 (12): 1221-1225.
18. Jones MD, Alden P Fountain KJ, Aubin A. Waters Application Note 720003721EN. 2010.